How to Embed a Live Weather Radar Map on Your Website (Free)
You can now put Weather Scope's live weather map on your own website. The free embed gives your visitors an interactive radar and forecast map that they can pan, zoom and scrub through time, all inside a single iframe. There is no API key, no account and no code to maintain: pick a layer, set the starting view, choose a theme and size, then paste one snippet into your page.
It works on any site that lets you add custom HTML, including WordPress, Squarespace, Wix, Webflow, Ghost, Shopify and hand-written pages. Below is everything you need to embed a live weather radar map on your website in a few minutes.
What the embedded weather map shows
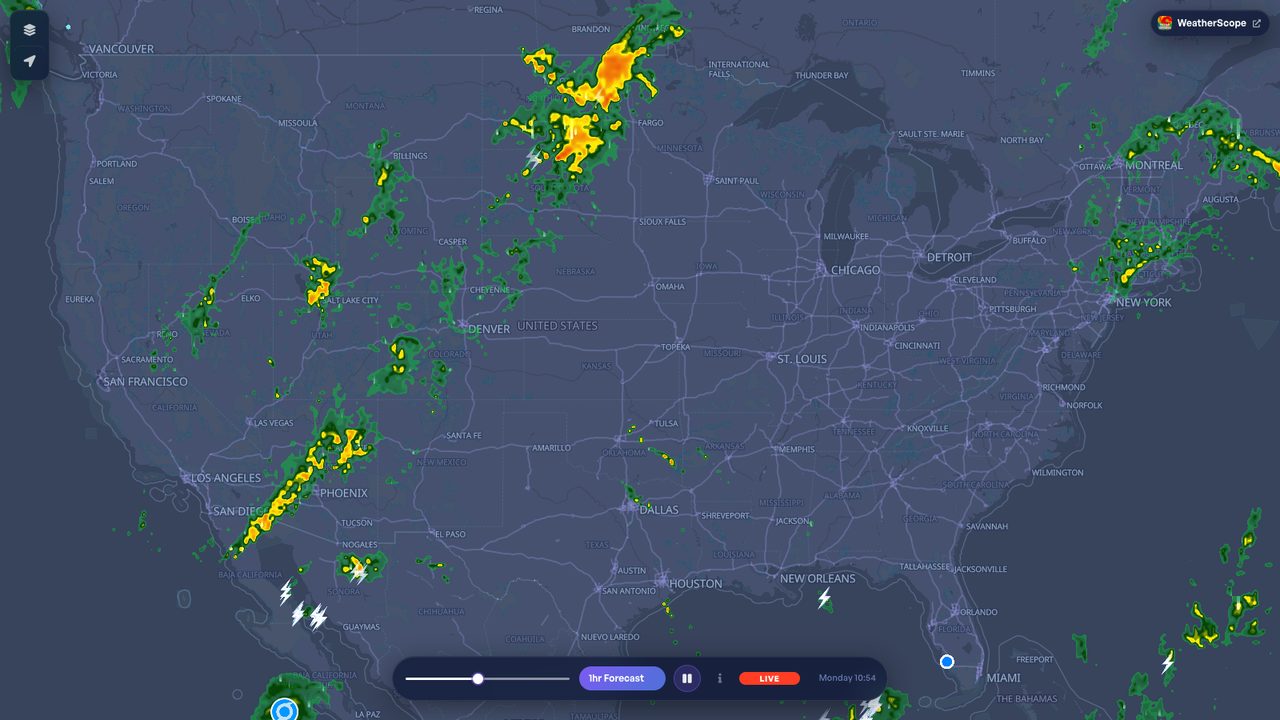
The embed is the same map engine that powers the Weather Scope app and the full-screen radar on weatherscope.com. Your visitors get:
- Live global radar with smooth animation, updated continuously, plus a timeline they can drag to look back over recent hours or ahead into the short-range forecast.
- Satellite and radar blended together, and NEXRAD base and composite reflectivity for the United States.
- 17 fourteen-day forecast layers from the GFS model: temperature, feels-like, dew point, humidity, cloud cover, wind speed and gusts, pressure, CAPE, visibility, precipitation accumulation, snow depth, UV index, soil temperature, wave height, air quality, and dust and smoke.
- 8 short-range forecast layers from the RRFS model, including simulated reflectivity, echo tops, lightning threat, hail, supercell composite, wind gusts and tornado potential.
- Active tropical systems from the National Hurricane Center, shown automatically when a storm is active.
- Value readouts on the map, so a temperature or wind layer shows real numbers, not just colours.
Visitors can switch layers from the layers button inside the frame, or you can lock the experience down by hiding the controls and timeline. Both a dark and a light theme are available so the map fits your page.
How to embed the map in three steps
- Open the embed builder at weatherscope.com/embed.
- Set it up. Choose a layer, drag and zoom the live preview to the starting view you want (or let the map centre on each visitor's own location), pick dark or light, and choose a responsive or fixed size.
- Copy and paste. Click Copy code and paste the snippet into your page wherever custom HTML is allowed.
The generated code looks like this. The wrapper keeps the map at a 16:9 ratio and lets it fill whatever width your layout gives it:
<div style="position:relative;width:100%;padding-bottom:56.25%;height:0;overflow:hidden;border-radius:12px;">
                    <iframe src="https://weatherscope.com/embed/map?lat=39.5&lon=-98.35&zoom=4"
                    style="position:absolute;top:0;left:0;width:100%;height:100%;border:0;"
                    title="WeatherScope live weather map" loading="lazy" allowfullscreen></iframe>
                    </div>
Prefer a fixed size? Choose Fixed width × height in the builder and you get a plain iframe with width and height attributes instead.
Customise the embed with URL parameters
The builder writes these for you, but you can also compose an embed URL by hand. Every parameter is optional, and an invalid value simply falls back to its default rather than breaking the map.
- lat and lon: the starting centre. Leave both out and the map centres on each visitor's approximate location instead.
- zoom: 1 to 18. Around 4 shows a whole country, 7 to 8 a metro area, 10 and above a city.
- layer: which weather layer is on when the map loads. For example
radar(default),satellite,us-composite,temperature,wind-speed,precip-accumulation,air-qualityorrrfs-reflectivity. The full list of layer names is on the embed page. - theme:
dark(default) orlight. - controls: set to
0to hide the layers and locate buttons. - timeline: set to
0to hide the radar timeline. - t: open the timeline at a specific moment, for example
2026-10-01T18:00Z. Handy for pointing readers at a forecast for an event. - pin: drop up to ten labelled markers, written as
lat,lon,Labeland separated by|.
Three ways people use it
Local radar for a community or news site
Centre the map on your town at zoom 8 and leave the default radar layer on. Readers get a live, animated view of rain and storms approaching, and the timeline lets them see where the weather is heading over the next hour.
https://weatherscope.com/embed/map?lat=30.27&lon=-97.74&zoom=8A 14-day temperature outlook for a travel or outdoor page
Switch the layer to temperature and hide the controls so the page stays focused. Visitors can still drag the timeline through the two-week forecast.
https://weatherscope.com/embed/map?lat=36.1&lon=-112.1&zoom=7&layer=temperature&theme=light&controls=0Storm-season satellite view for a marine or aviation audience
Satellite plus radar over the Gulf, with a pin on your marina, airport or event location.
https://weatherscope.com/embed/map?lat=27.5&lon=-88&zoom=5&layer=satellite&pin=27.95,-82.46,TampaAdding it to WordPress, Squarespace, Wix and others
- WordPress: add a Custom HTML block in the block editor (or a Text/HTML widget in a sidebar) and paste the snippet. If your theme strips iframes for contributors, paste it as an administrator.
- Squarespace: add a Code block and paste the snippet with the HTML option selected.
- Wix: use Embed Code → Embed HTML, paste the snippet, then size the element.
- Webflow, Ghost, Shopify and static sites: use the platform's embed or custom HTML element, or paste it straight into your template.
Because the iframe uses loading="lazy", the map only loads when it scrolls into view, so it will not slow down the rest of your page.
Good to know
- The embed is free for personal, editorial and commercial websites. The small Weather Scope badge in the corner is the attribution the embed is offered under, so please keep it visible.
- It is fully interactive on desktop and mobile, and it follows the size of the container you place it in.
- Layers and features can change over time as we add new data. Existing embed URLs keep working; an unknown layer name simply falls back to radar.
- Weather data is provided for general information and should not be used for safety-of-life decisions. For high-traffic or white-label use, get in touch.
Frequently asked questions
Is the Weather Scope embed really free?
Yes. There is no API key, no sign-up and no usage plan for normal website use. We only ask that the attribution badge stays visible.
Can my visitors change the layer?
Yes, unless you hide the controls. The layers button inside the frame opens the same layer picker you get on weatherscope.com, including radar, satellite, the GFS forecast fields and the RRFS short-range fields.
Can I show each visitor their own local weather?
Yes. Choose Visitor's location in the builder, or simply leave lat and lon out of the URL. The map then centres on the visitor's approximate location automatically.
Does it work on mobile?
Yes. The responsive snippet scales with the page, and the map's controls and timeline adapt to small widths. Pinch-zoom and drag work as you would expect.
Can I control the map from my own page?
Yes. The frame posts its current position to your page as it moves and accepts messages to reposition it or switch the theme, so you can sync it with your own buttons or location picker. The details are documented on the embed page.
Get started
Head to weatherscope.com/embed, build your map, and paste it in. And if you want the full experience with alerts, AI forecasts and premium layers in your pocket, download Weather Scope for iPhone, Apple Watch and Android.